Supply Drop 2
Scenario
Following the incident detailed in Supply Drop 1, triage of Khaled’s workstation at EZ-CERT revealed multiple signs of compromise — persistence mechanisms, data exfiltration, and a disguised remote access tool. Before the attacker disappeared from the network, they downloaded and executed a suspicious binary: w64time.exe. Initially overlooked due to its resemblance to the legitimate Windows Time service (w32time), further analysis revealed encrypted outbound connections and suspicious memory allocations shortly after execution. As part of the EZ-CERT response team, the task is to uncover its full behaviour, capabilities, and configuration.
Methodology
Static Analysis — Initial Triage
The artefacts directory contains w64time.exe alongside a password.txt and SupplyDrop2.7z. The filename itself is the first indicator — w64time masquerades as the legitimate w32time Windows Time service binary (T1036.005).
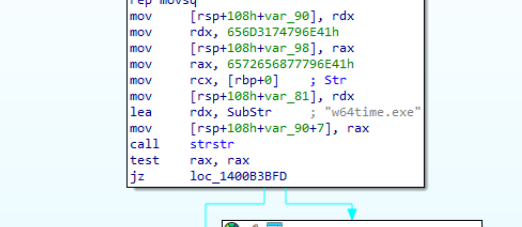
Loading w64time.exe into IDA and checking the .rdata section immediately surfaces a hardcoded string:
SubStr: "w64time.exe"
This string is referenced by the TLS callback chain, which calls a function using strstr to verify the binary’s own filename at runtime. If the check fails — for example, if the analyst has renamed the binary — the process terminates. This is the filename verification routine.
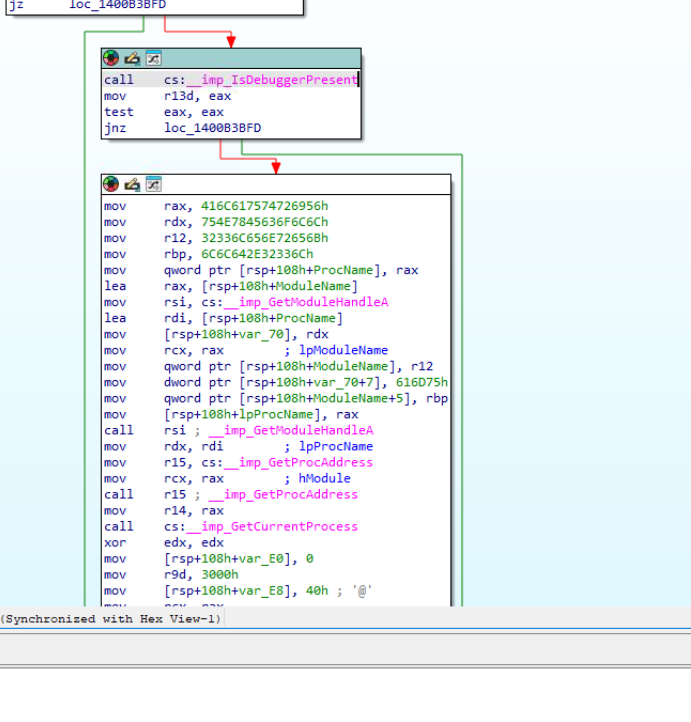
The imports table confirms IsDebuggerPresent is present and called within the TLS callbacks before the entry point is ever reached. TLS callbacks execute before main, making this an effective early-exit trap for debugger-attached sessions.
Anti-Debug — TLS Callback Evasion
IDA identifies two TLS callbacks: TlsCallback_0 and TlsCallback_1. Both call sub_14000BC20, which orchestrates the evasion checks. The IsDebuggerPresent call is followed by a test eax, eax / jnz branch — if a debugger is detected, execution jumps to a termination path.
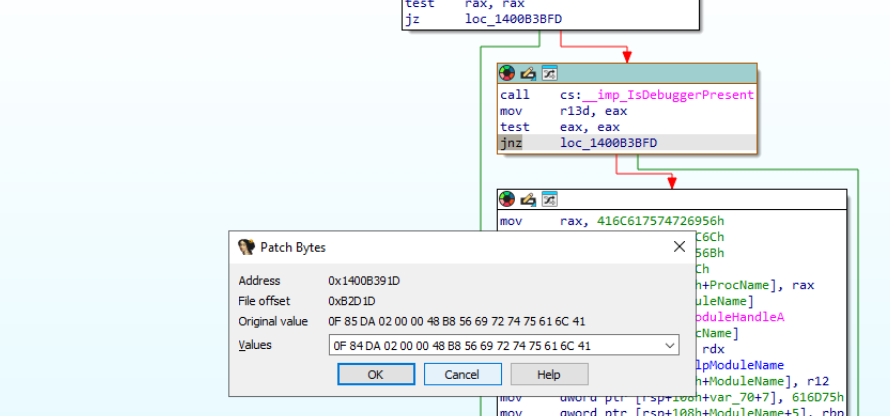
The jnz opcode (0F 85) was patched to jz (0F 84) in IDA’s Patch Bytes dialog to flip the branch logic, allowing execution to continue past the check.
Even with this patch applied, a watchdog thread spawned from the TLS context continued detecting the debugger via secondary checks and calling ZwTerminateProcess. The most reliable approach for dynamic analysis was attaching x64dbg to the process after the TLS callbacks had already executed — bypassing the detection window entirely.
Dynamic Analysis — Sleep and Memory Allocation
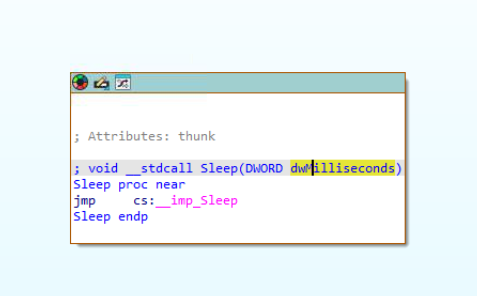
With x64dbg attached post-TLS, the binary was allowed to run. Static analysis of sub_1400B3850 had already identified the Sleep call site:
mov ecx, 1D4Ch    ; dwMilliseconds = 7500
call cs:__imp_Sleep
0x1D4C = 7500ms — a deliberate delay before any suspicious activity begins, intended to outlast sandbox timeout windows.
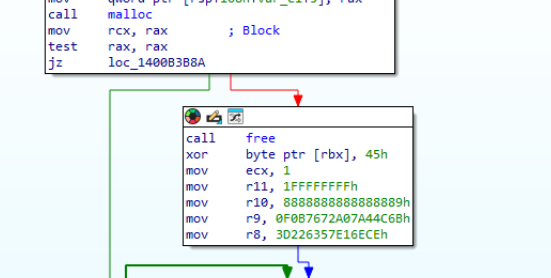
Immediately after the sleep, a large malloc call allocates a significant memory region:
mov ecx, 0EE6B280h    ; Size = 250,000,000 bytes
call malloc
250MB of heap space — far beyond any legitimate operational need. This large allocation is consistent with techniques used to exhaust memory analysis tool visibility or obscure payload delivery staging.
With the patched binary loaded and x64dbg attached post-TLS, a breakpoint was set on the decryption loop at w64time.exe+B3A70. The BP confirmed the loop executing against the encrypted blob in .rdata. 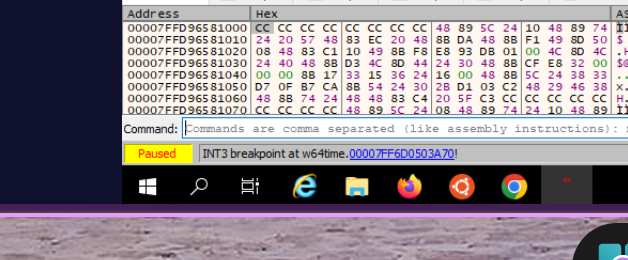
Decryption — XOR with Hardcoded Key
Following the allocation, the binary enters a decryption loop processing encrypted content embedded in the .rdata section. The loop uses a keystream-based XOR cipher:
loc_1400B3A70:
    movzx eax, byte ptr [rsp+rax+108h+var_98]
    xor   [rbx+rcx], al
    add   rcx, 1
    imul  rax, r9
    ror   rax, 4
    cmp   r8, rax
    jb    short loc_1400B3A70
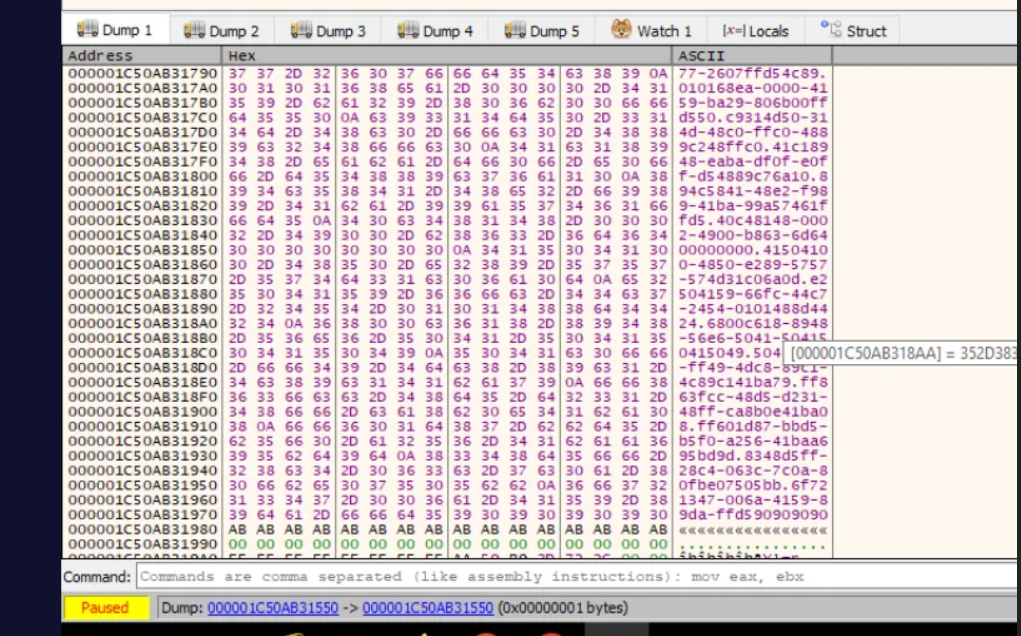
The key was recovered dynamically by dumping the stack frame at RSP during execution. The initialised lookup table at var_98 revealed the full plaintext key in the ASCII column of the memory dump: 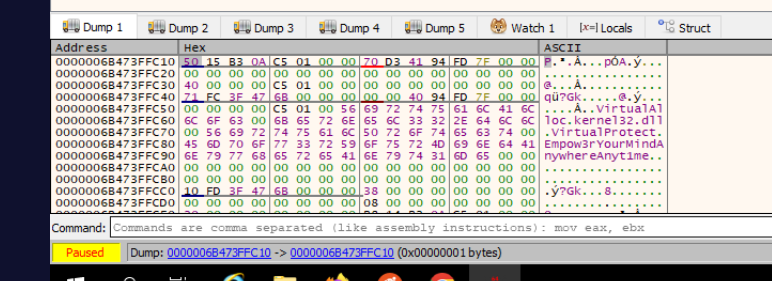 The hardcoded key is
 Empow3rYourMindAnywhereAnytime — a passphrase seeding the keystream generator. Static analysis of the stack initialisation had surfaced partial fragments (Empow3rY, Anytime) but the full string only became clear at runtime, confirming the lab author’s intent that dynamic analysis is the correct path for this sample.
The decryption method is XOR. The hardcoded key seeding the keystream is initialised in the stack frame before the loop executes.
Shellcode Loading — UUID Technique
The decrypted output is a sequence of UUID-formatted strings, separated by newline delimiters and parsed using strtok. Each UUID string is then converted to 16 bytes of binary data using the Windows API UuidFromStringA:
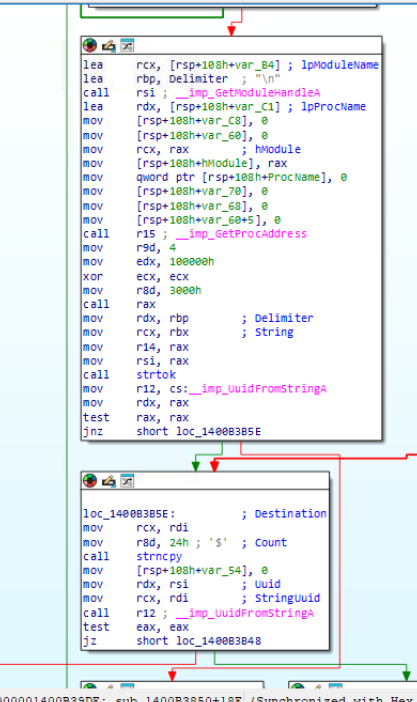
mov rcx, rdi        ; StringUuid
call r12            ; __imp_UuidFromStringA
This technique — storing shellcode as UUID strings — is a known AMSI and memory-scanner evasion method. The shellcode is never present in raw binary form within the PE; it only materialises in the allocated buffer after decryption and conversion. The decrypted UUID sequence was confirmed by dumping the output buffer at runtime after the decryption loop completed:
 Each line is a UUID string representing 16 bytes of shellcode. The final line in the sequence —
 6f721347-006a-4159-89da-ffd590909090 — terminates with ffd5 (call rbp, a Cobalt Strike staging primitive) followed by 90909090 NOP padding, consistent with a Cobalt Strike stager payload. The Lazarus Group is documented using this exact UUID shellcode loading technique in active campaigns — the lab author confirmed this attribution in the challenge Discord.
With the UUID buffer dumped at runtime, the decoded shellcode content became readable starting at 000001F01C5B1550. Applying UuidFromStringA mixed-endian byte ordering (data1/data2/data3 little-endian, data4/data5 big-endian) to the first two UUIDs yields the opening 20 bytes of the assembled shellcode: 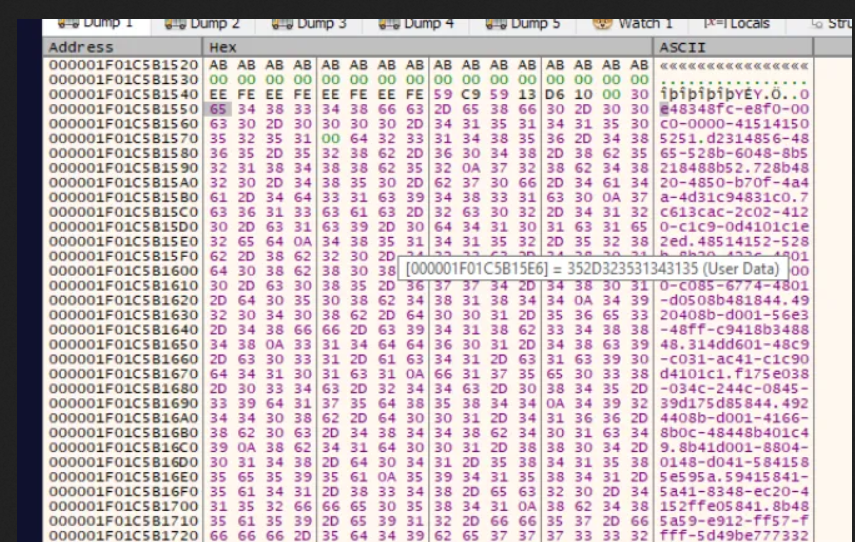 fc 48 83 e4 f0 e8 c0 00 00 00 41 51 41 50 52 51 56 48 31 d2
This is the Cobalt Strike x64 stager prologue —
fc 48 83 e4 f0 e8 c0 00 00 00 41 51 41 50 52 51 56 48 31 d2
This is the Cobalt Strike x64 stager prologue — CLD + AND RSP stack alignment followed by the standard calling convention register push sequence (r9, r8, rdx, rcx). Consistent with the ffd5 (call rbp) terminator observed at the tail UUID.
Execution — EnumCalendarInfoExA
With the shellcode assembled in the allocated buffer, the binary passes the buffer pointer as a callback argument to EnumCalendarInfoExA:
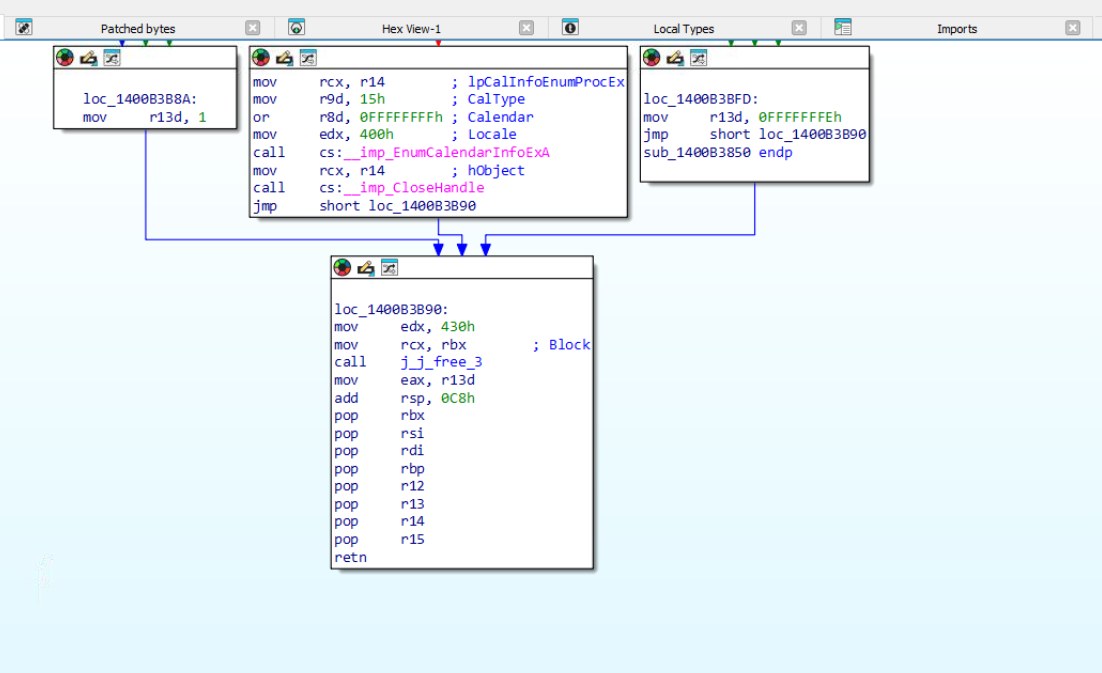
mov rcx, r14        ; lpCalInfoEnumProcEx = shellcode buffer
call cs:__imp_EnumCalendarInfoExA
Using a legitimate Windows enumeration API as a shellcode trampoline is a classic indirect execution primitive (T1055.012) — the API calls into the supplied function pointer, transferring control to the shellcode without an obvious CreateThread or VirtualProtect+call pattern.
C2 Communication
After shellcode execution, the binary initiates outbound connections. With no network analysis tools available in the VM, the binary was launched clean and monitored via PowerShell, filtering by the w64time.exe PID from Task Manager:
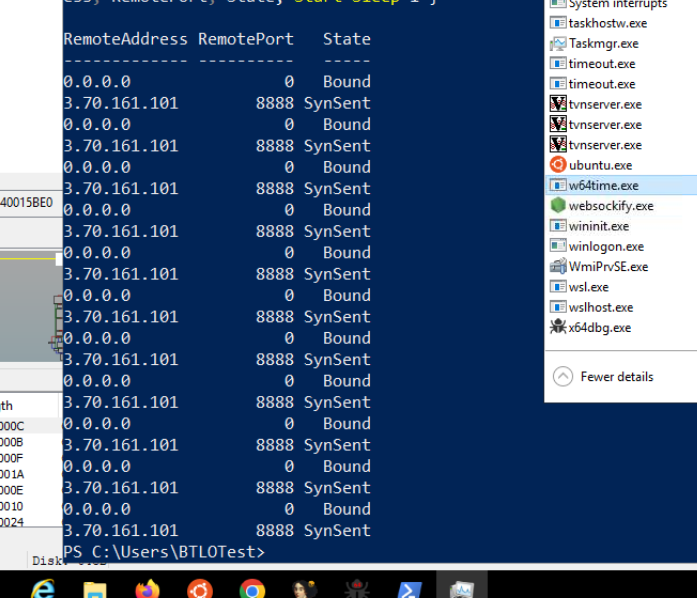
while($true) {
    Get-NetTCPConnection | Where-Object {$_.OwningProcess -eq 6776} |
    Select RemoteAddress, RemotePort, State
    Start-Sleep 1
}
The binary consistently beaconed to a single external host over port 8888.
Attack Summary
| Phase | Action |
|---|---|
| Masquerade | w64time.exe mimics legitimate w32time Windows Time service |
| Filename Check | strstr verifies binary is running as w64time.exe |
| Anti-Debug | IsDebuggerPresent called in TLS callback before entry point |
| Delay | Sleep(7500ms) before any suspicious activity |
| Allocation | malloc(250,000,000) to stage decrypted payload |
| Decryption | XOR cipher with hardcoded key decodes embedded payload |
| Shellcode Assembly | UuidFromStringA converts UUID strings to binary shellcode |
| Execution | EnumCalendarInfoExA used as shellcode execution trampoline |
| C2 | Encrypted beacon to 3.70.161.101:8888 |
IOCs
| Type | Value |
|---|---|
| File | w64time.exe |
| Filename Lure | Masquerades as w32time (Windows Time service) |
| C2 IP | 3[.]70[.]161[.]101 |
| C2 Port | 8888 |
| Sleep Duration | 7500ms pre-activity delay |
| Allocation Size | 250,000,000 bytes |
MITRE ATT&CK
| Technique | ID | Description |
|---|---|---|
| Masquerading: Match Legitimate Name | T1036.005 | Binary named w64time.exe to mimic w32time |
| Debugger Evasion | T1497.001 | IsDebuggerPresent in TLS callback pre-entry |
| Process Injection: shellcode | T1055.012 | EnumCalendarInfoExA shellcode trampoline |
| Deobfuscate/Decode Files | T1140 | XOR decryption of embedded UUID-encoded shellcode |
| Application Layer Protocol | T1071.001 | C2 beaconing over port 8888 |
Defender Takeaways
TLS callback inspection — Anti-debug and evasion logic hidden in TLS callbacks executes before the PE entry point, before most debugger breakpoints are effective and before many sandbox hooks are in place. Static analysis of the .tls section and both TLS callback functions should be standard practice in binary triage.
Filename-dependent execution — The binary checks its own filename using strstr before proceeding. Defenders renaming suspicious binaries for analysis may inadvertently trigger early termination and miss subsequent behaviour. Always analyse under the original filename in an isolated environment.
UUID shellcode delivery — Storing shellcode as UUID strings and assembling it at runtime using UuidFromStringA produces no raw shellcode bytes in the binary’s static content. Traditional byte-pattern AV signatures are ineffective. Behaviour-based detection targeting UuidFromStringA called in sequence with EnumCalendarInfoExA is a durable detection primitive.
Indirect execution via enumeration APIs — EnumCalendarInfoExA, EnumSystemLocalesA, and similar callback-accepting APIs are frequently abused as shellcode trampolines. SIEM rules or EDR detections flagging these APIs called from unsigned or anomalous binaries add meaningful coverage.
Oversized heap allocations — A single malloc(250,000,000) call from a binary claiming to be a time service is immediately anomalous. Memory analysis tooling and EDR heap telemetry should flag allocations of this magnitude from non-system processes.